HF Spectrum Monitor Technical Information
Location : Central Southampton, UK
This website allows you to connect to and control a wideband software defined HF radio receiver connected to this server.
It offers a full 30MHz instantaneous view of the HF spectrum, which can be zoomed to show bands in detail.
You have tuning control of one of the receiver's DDC tuned channels. You can view the narrowband spectrum
in this channel, and listen to the output of a demodulator via streaming audio.
All the data collection, processing and graph creation is performed on the server, with the browser acting as a
display and request interface. The system is free to use and no login details are required.
When you load the viewer, you will be allocated a temporary ID that allows you to tune one channel and view the
tuned and wideband spectra.
Queries and suggestions may be sent to
Note that some man-made interference (QRM) is seen from VDSL signals on nearby phone lines.
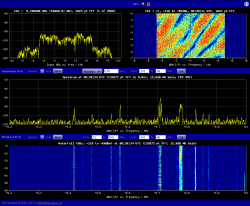
Main Viewer
(Live 30MHz spectrum, tune and listen to audio)
 Main Viewer (All plots on one large display)
Tabbed Viewer (Multiple tabs, smaller display)
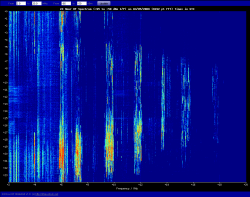
24 Hour Waterfall Viewer
(See one full rolling 24 hour waterfall)
24 Hour Viewer
A 7 day 24 hour zoom-able waterfall display shows a chosen section of the spectrum built up from snapshots
taken at 2 minute intervals. The "live" page shows data over a rolling 24 hours (data from 00:00 UTC to "now" from today, data from "now" to 23:59 UTC from yesterday). Previous days completed spectra may be selected for comparison. Fully zoomed resolution is approximately 380 Hz / bin (windowed).
Hardware and software details
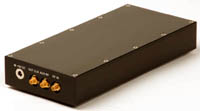
This HF Spectrum Monitor is based around a commercial Digital Wideband Receiver. This digitises the antenna input using a 16bit
ADC at 80 MHz, providing a wideband signal snapshot together with four 48kHz narrowband tuned outputs. The receiver output is
via high speed USB2.
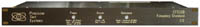
A precision low phase noise crystal frequency reference from
Precision Test Systems
provides a stable 80MHz clock for the receiver.
Although the receiver itself has a good on-board crystal, this reference provides a stable signal with around 0.01ppm accuracy.

The receiver is connected via USB2 to the 2U web server (Intel i5-4570 3.2 GHz, 8 GB RAM, 2x120 GB SSD RAID1 disks).
This allows multiple users to view the wideband spectrum, and each user may tune one narrowband channel and view a
narrowband spectral plot or provide audio output.
A separate 24 hour waterfall plot may be viewed and zoomed independently by each user.
The server runs CentOS Linux. The connection to the internet is via 38 Mbit VDSL modem / router.
The antenna is a 1.1m active loop made by
Wellbrook Communications.
It is mounted on a vertical metal pole (also used for a washing line) around 2.5m above the ground.
Data collection, receiver control and image generation software is written in "C".
The data collection program runs continuously, saving sections of wideband and narrowband
data to temporary RAM files. All images are produced using the GD library in PNG format on demand from the user's web browser.
The main web page contains HTML5 viewers that display these graphs and allow receiver control.
Useful links


